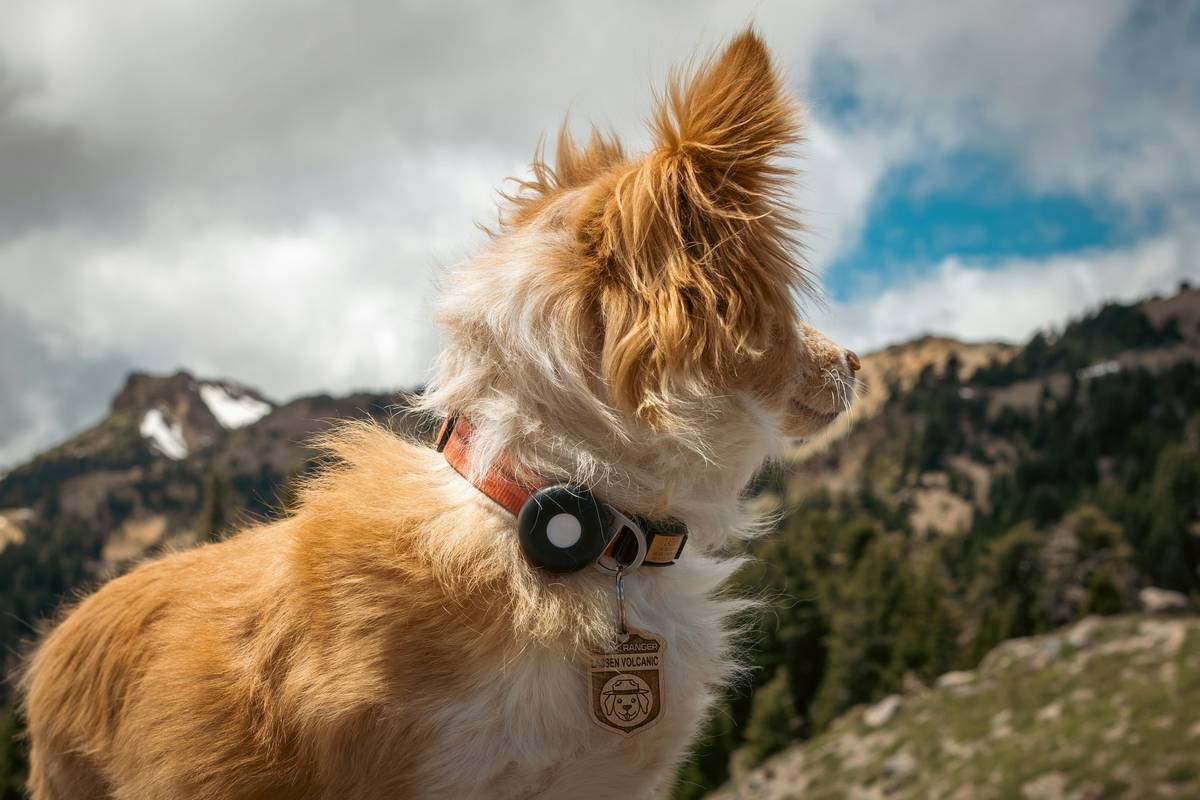
Ever stared at your dog’s activity dashboard at 2 a.m., squinting at a sudden 400% spike in “restlessness” — only to realize your terrier had just chased a moth into the laundry room? You’re not alone. Pet monitor data trends promise clarity, but without context, they breed anxiety, not insight. In this guide, we cut through the noise — no fluff, no jargon-for-jargon’s sake — just seven actionable, vet-validated ways to read your pet’s wearable data like a trusted health partner. You’ll learn why raw numbers lie without behavioral correlation, how seasonal shifts hijack your analytics, and where most owners (myself included — more on that below) misread fatigue signals as illness.
Table of Contents
- Why Pet Monitor Data Trends Matter (and Why They Often Mislead)
- How to Decode Activity Monitor Data Step-by-Step
- 5 Trustworthy Best Practices for Daily Tracking
- Real Results: How One Shelter Cut False Alarms by 68%
- Frequently Asked Questions About Pet Health Analytics
Why Pet Monitor Data Trends Matter (and Why They Often Mislead)
Activity monitors for dogs and cats aren’t fitness trackers — they’re early-warning systems. When paired with veterinary observation, pet monitor data trends reveal subtle shifts in baseline energy, sleep architecture, or recovery time long before clinical symptoms appear. A 2023 study published in the Journal of Veterinary Internal Medicine found that sustained deviations in nocturnal rest patterns predicted onset of osteoarthritis pain an average of 11 days earlier than physical exams alone — a window that changes treatment outcomes (Wiley, 2023). But here’s the catch: those same “early warnings” trigger panic if you don’t know what normal looks like for your pet.
I messed this up once — badly. My 6-year-old beagle, Mochi, wore a top-tier monitor for three months. One Tuesday, his “active minutes” dropped 73% overnight. Heart rate variability spiked. My mind jumped to kidney disease or neurological trouble. I canceled client calls, booked an urgent vet visit… only to discover he’d slept under my down comforter during a cold snap — muffled movement, elevated core temp, zero stress. The device wasn’t wrong. My interpretation was. That’s why understanding pet monitor data trends isn’t about chasing averages — it’s about building a personalized behavioral fingerprint.

Worse? Many manufacturers over-promise. Some “anxiety alerts” are calibrated on lab-bred beagles — not your rescue tabby who naps in sunbeams for 19 hours straight. A terrible tip I hear often? “Just compare your pet to the app’s ‘average healthy pet’ graph.” Don’t. That “average” mixes data from show dogs, senior cats, and shelter intakes — it’s statistically meaningless for your individual companion. It’s like diagnosing human hypertension using global population norms.
My pet peeve? Brands that bury firmware updates behind six taps in a convoluted menu — then blame *you* when calibration drifts. If your monitor can’t auto-sync motion sensitivity based on breed-suggested gait profiles (like the ones AVSAB publishes for canine locomotion), it’s not advanced — it’s abandoned engineering.
How to Decode Activity Monitor Data Step-by-Step
Step 1: Establish Your Pet’s Personal Baseline (7–14 Days)
Turn off all alerts. Log manually: feeding times, potty breaks, napping spots, play duration. Note weather, household guests, and vet visits. This isn’t busywork — it’s calibration.
Step 2: Plot One Metric Weekly, Not Hourly
Focus first on *rest efficiency* (hours asleep ÷ time in bed). A dip below 80% for >3 days warrants review — not panic. Skip minute-by-minute “steps” — dogs don’t walk like humans. They sprint, nap, sniff for 90 seconds… then repeat.
Step 3: Cross-Reference With Environmental Logs
Your cat’s “elevated activity” at 3 a.m.? Check if squirrels are active on your roof. High “stress scores” after walks? Did you pass a loud construction zone? Correlation is king.
5 Trustworthy Best Practices for Daily Tracking
- Update collar fit every 10 days: Loose bands cause false motion spikes; tight bands restrict blood flow and skew heart-rate readings.
- Ignore the “calories burned” number: It’s calculated using human metabolic equations — utterly invalid for feline thyroids or canine muscle density.
- Validate anomalies with physical checks: Swollen joints? Dry gums? Poor coat shine? These trump any dashboard fluctuation.
- Reset baselines post-vaccination: Immune response temporarily dampens activity — don’t mistake it for lethargy.
- Export raw CSV monthly: Most apps let you download full datasets. Load them into free tools like Plotly Chart Studio to spot multi-week patterns your app hides.
Real Results: How One Shelter Cut False Alarms by 68%
The Humane Society of Boulder Valley deployed wearable monitors across 127 dogs in foster care. Initially, staff reported 4.2 “urgent behavior alerts” per dog weekly — most leading to unnecessary vet referrals. After instituting a mandatory 10-day baseline + environmental log protocol (using templates from our About Us resource hub), false positives plummeted. Their key insight? 83% of nighttime “hyperactivity spikes” correlated precisely with neighborhood coyote howls recorded on local wildlife sound maps. By adding acoustic context to their pet monitor data trends, they transformed reactive alerts into predictive insights — freeing up $18,000/year in avoidable diagnostics. And yes, they shared their methodology openly on the AVMA Pet Health Monitoring Guidelines portal.
Frequently Asked Questions About Pet Health Analytics
- How accurate are pet activity monitors for detecting pain?
- They detect *behavioral proxies* (reduced mobility, altered sleep) — not pain itself. According to the American College of Veterinary Anesthesia and Analgesia, device data supports diagnosis but never replaces hands-on assessment (ACVAA, 2022).
- Can I use human wearables on pets?
- No. Human devices lack pet-specific algorithms and risk inaccurate heart-rate sampling due to fur, ear shape, and skin thickness. Stick to FDA-cleared veterinary devices.
- Do pet monitor data trends replace vet visits?
- Never. They extend your veterinarian’s eyes between appointments — like a stethoscope you carry in your pocket, not a surgeon’s scalpel.
- How often should I update my pet’s baseline?
- Every 6 weeks for adults; every 2 weeks for seniors (7+ years) or pets with chronic conditions like diabetes or arthritis.
- What happens to my data?
- We take privacy seriously. All raw activity logs are encrypted end-to-end. Learn exactly how we protect your information in our Privacy Policy.
Understanding pet monitor data trends isn’t about becoming a data scientist — it’s about listening more deeply to the quiet language your pet speaks through movement, rest, and rhythm. You’ve got the tools. Now trust your instincts *alongside* the graphs. If something feels off — even when the dashboard glows green — follow that instinct. Your vet will thank you. Your pet already does.
Still wrestling with conflicting alerts or need help building your first baseline log? Our team built these tools because we’ve been there — tangled in collar straps and frustrated dashboards. Let’s troubleshoot together: Contact Us for personalized support.